Contact Us
Latest News
- Clues beginning to emerge on asymtomatic SARS-CoV-2 infection
- Back in November of 2020, during the first wave of the COVID-19 pandemic, I was teaching an in-person microbiology laboratory. One of my students had just been home to see his parents, and they all c…
- Read more
- Could there maybe be better uses of genetics and probiotics?
- Professor Meng Dong and his laboratory have created a probiotic that can metabolize alcohol quickly and maybe prevent some of the adverse effects of alcohol consumption. The scientists cloned a highl…
- Read more
- ChatGPT is not the end of essays in education
- The takeover of AI is upon us! AI can now take all our jobs, is the click-bait premise you hear from the news. While I cannot predict the future, I am dubious that AI will play such a dubious role in…
- Read more
- Fighting infections with infections
- Multi-drug-resistant bacterial infections are becoming more of an issue, with 1.2 million people dying of previously treatable bacterial infections. Scientists are frantically searching for new metho…
- Read more
- A tale of two colleges
- COVID-19 at the University of Wisconsin this fall has been pretty much a non-issue. While we are wearing masks, full in-person teaching is happening on campus. Bars, restaurants, and all other busine…
- Read more
( 56678 Reads)
None Max
Another important facet of microbiology is the observation of microbes and due to their small size, microscopes are necessary. Besides being able to visualize cell morphology and specialized structures, microscopes can even be used to identify bacteria in mixed samples when combined with certain fluorescent probes. These instruments are thus becoming indispensable tools in microbial ecology as well as their traditional use for observation and in identification.
Staining microbes
Before observing microorganisms, they must be placed on a suitable physical support so that they can be observed under a microscope. For light microscopes this simply entails placing a bit of culture on a glass slide. All liquid is allowed to evaporate and the microbes are then heat-fixed to the slide, usually by heating the slide momentarily over a Bunsen burner. Heat fixation breaks down some of the outer cell wall components, making them sticky, and cements the microbes to the slide so that they will not wash off during subsequent staining procedures. The slide is then cooled and ready for staining. Figure 30.9 shows the preparation of a smear.
Figure 30.9. Smear preparation. Before a sample can be stained, a sample must be applied to a slide and then heat-fixed to cement the cells to the slide.
Stains for the light microscope
In their natural state, many microorganisms are nearly transparent and not easily visible. They are made of water and other materials that do not readily absorb light and thus can be difficult to detect. A method is often necessary to differentiate microorganisms from the surrounding background and many staining techniques have been developed for this purpose. Figure 30.10 shows the structure of crystal violet.
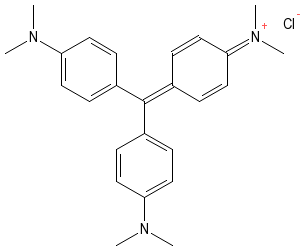
Figure 30.10. Crystal Violet. The structure of crystal violet. Note the positive charge that allows the dye to bind to the bacterial cell.
In most staining protocols a dye that readily absorbs light is mixed with a smear of microorganisms. The dyes contain charged groups and they readily bind to various macromolecules on the microbes. However, these dyes do not bind to the glass surface and are therefore easily washed from the background. After staining, one ends up with a smear where certain structural features of the microorganisms take on the color of the dye and the surrounding background is colorless. Stains have two important functional groups, the chromophore group and the auxochrome group. The chromophore group contains arrays of doubles bonds that absorb light and gives the stain its characteristic color. The auxochrome group contains either a positive or negative charge and allows the dye to bind microbial structures of opposite charge. The charge also makes the dye more soluble in aqueous medium, often a necessity for biological studies.
There are different stains that are used with different types of microscopes. Here we will introduce just a few examples to give you a general idea of the types of staining protocols. In a simple stain the smear is flooded with a single dye and allowed to incubate for a minute or two after which excess dye is rinsed off the slide. All microbial cells in the specimen that bind dye will be the same color. Simple stains can be positive stains, where the dye binds to the microbe and its structures, or negative stains, where the dye is repelled by the microbe, but stains the background. Note that in the latter case the stain is not washed off the slide. Figure 30.11 shows a simple stain with safranin and a negative stain, the capsule stain.
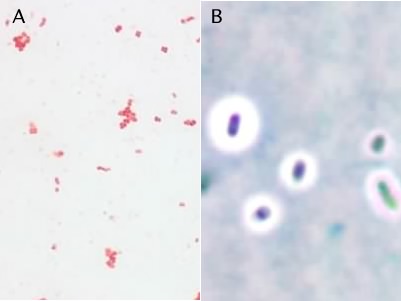
Figure 30.11. The simple stain and the capsule stain. Panel A is a photomicrograph of a simple stain of Staphylococcus epidermidis. Panel B shows an India ink stain (a negative stain) of Klebsiella planticola
In a differential stain, the smear is exposed to a series of different dyes. This technique takes advantage of the fact that particular structures have variable affinities for specific dyes. The first dye is applied to the smear and then a fixing reaction, either another chemical or heat, is applied so that those cells that have bound the dye retain it. A washing step removes any unbound dye and a second dye can be applied as a counter stain.
The Gram stain is the most commonly used differential staining procedure. Smears are first exposed to the dye crystal violet, which stains all bacterial cells purple. Crystal violet penetrates many bacterial structures, binding to the negative charges throughout the cell. Excess crystal violet is then washed off the cells and iodine is applied. Iodine reacts with the crystal violet forming complexes that become trapped in some cells. Subsequent treatment with alcohol-acetone decolorizes cells that do not bind the crystal violet-iodine complex tightly. Finally a counter stain with safranin, a red dye, stains all cells parts pink. The net effect is that all cells can be visualized by the red stain, yet Gram-positive cells can be recognized in the mix by their violet stain. Figure 30.12 shows the steps of the Gram stain
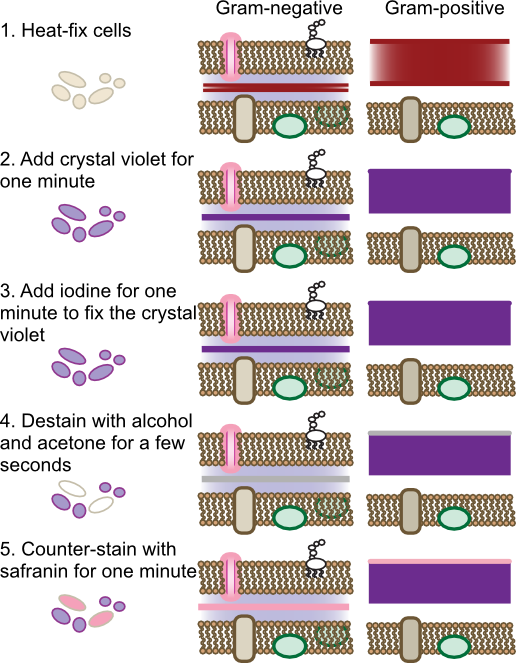
Figure 30.12. Steps of the Gram stain. The Gram stain is a four-step process that differentiates cells based upon their cell wall structure. The behavior of gram-positive and gram-negative cell wall is shown. Note that the dyes will also bind to any other negative-charged compounds in the cell, but only binding to the peptidoglycan is shown.
The Gram stain was originally developed by the Danish physician Hans Christian Gram in 1884 to differentiate pneumococci in samples of lung tissue. At the time the cellular basis of the stain was not clear, but we now know it depends upon the cell wall structure of the microorganism. For microbes of the domain Bacteria, cells containing thick peptidoglycan layers are able to retain the crystal violet-iodine complex and appear Gram positive. Those that have thinner peptidoglycan layers are easily decolorized by the alcohol wash and are only visible after counter-staining, thus being Gram negative. The staining procedure of Gram was actually differentiating the two basic cell wall structures present in the Bacteria. As discussed in Chapter 3, there are some cells that contain a Gram-negative cell wall structure that stains Gram positive due to other properties, and the opposite is also true. The archaea have very different cell wall structures and the Gram reaction of each species does not normally predict anything useful about its cell wall.
Another important stain is the acid-fast stain. During his work on the causative agent of tuberculosis, Robert Koch had a difficult time visualizing the bacteria. The microbes would not bind conventional stains and it was difficult to detect them in the sputum of infected patients. After much experimentation, he settled on the acid-fast stain developed by Paul Erhlich and the microbes became visible. In the acid-fast stain, the smear is initially stained by heating cells to near boiling in a solution of the stain carbol fuchsin and then destaining with acid-alcohol. The destaining decolorizes non-acid-fast bacteria and these are then counterstained with methylene blue. Acid-fast bacteria appear red under the microscope, while non-acid-fast bacteria are blue. Figure 30.13 shows the acid fast stain.
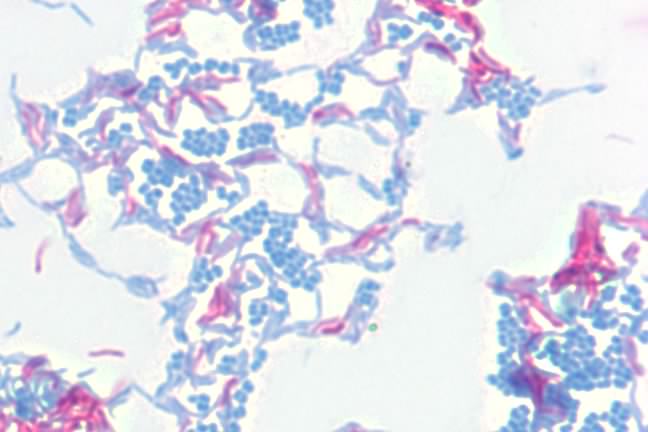
Figure 30.13. The acid-fast stain. A photomicrograph of Mycobacterium smegmatis (pink) and Micrococcus luteus (blue) at 1000x magnification. M. smegmatis is acid-fast, retaining the carbol fuchsin dye, thus appearing pink. M. luteus is not acid-fast, loses the carbol fuchsin during decolorizaiton, and is counter-stained with methylene blue.
Acid-fast staining is crucial in the diagnosis of tuberculosis, which is caused in humans by Mycobacterium tuberculosis and related species. These microorganisms and a number of others have very hydrophobic, waxy cell walls that repel most stains, but the acid-fast procedure causes the carbol fuchsin dye to penetrate the walls and is trapped within the wall upon cooling.
It is also possible to stain specific structures in microorganisms and we call these structural stains. A good example of a structural stain is the endospore stain. Endospores have tight compact cell walls that are impermeable to most dyes and in the Gram stain they appear as colorless regions inside of the cell. In the endospore stain, the cells are boiled in the presence of the dye malachite green. The higher temperature causes the spore coat to expand, allowing the dye to penetrate the spore and malachite green is trapped inside the spore upon cooling. A wash with water removes the dye from vegetative cells and these are then counterstained with safranin. When examined using a microscope, spores appear green and vegetative cells are pink. Structural stains to detect flagellum, phosphorus globules and various other inclusions inside of cells are also common. Figure 30.14 shows an example of at structural stain, the endospore stain.
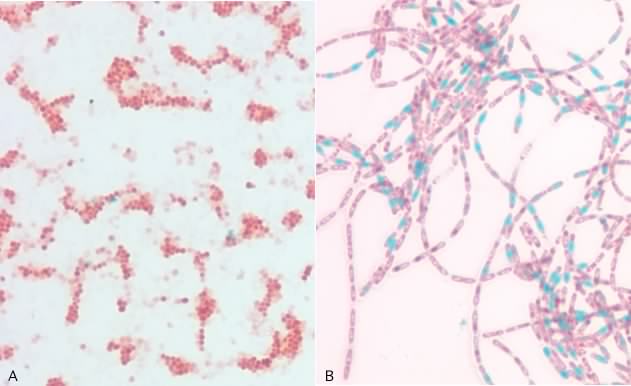
Figure 30.14. The endospore stain. A photomicrograph of an enodspore stain. Spores present in the picture stain green, while the vegetative cells stain red. A) Staphylococcus epdiermidis which does not form endospores. B) The endospore-forming rod, Bacillus cereus.
Most of the staining protocols we have talked about here were developed at the dawn of microbiology more than 100 years ago. The advent of 16S rRNA sequencing and phylogenetic analysis had lead to the development of a new set of tools that have similarities to staining protocols. Literally thousands of 16S rRNA sequences are known and analysis of these pieces of nucleic acid have lead to the discovery of regions that are diagnostic of specific species, families of microorganism or entire domains. It is therefore possible to design nucleic acid probes that bind to only a particular species, genera, family or an entire domain of microorganisms. This works because stable binding of two nucleic acid sequences depends on exactly how similar the two sequences are. The hybridization conditions (for example, the temperature and level of salt) can therefore be chosen so that only organisms with the desired sequences hybridize to the probe efficiently (for more detail see "DNA arrays" later in this chapter).
This in itself is interesting, but it becomes even more powerful when these probes are attached to fluorescent dyes that emit a specific color when exposed to UV light. A microbial sample is fixed to a surface in such a way that the nucleic acid and proteins stick, but the cells are permeable. To this is added a fluorescently tagged DNA probe and it is allowed to incubate for a period of time. Under appropriate conditions the probe penetrates the microbes and binds only to those bacteria that contain a matching 16S rRNA sequence. The poorly hybridizing probes are removed by an appropriate wash. When examined under a fluorescence microscope (see below) only microorganisms of the desired target group fluoresce. This provides a powerful new tool to access what is present in any environment. Figure 30.15 shows an example of a fluorescent stain.
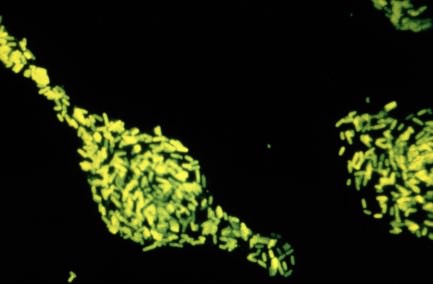
Figure 30.15. A fluorescent stain. A fluorescent dye is attached to antibodies against Salmonella enterica. When these antibiodies are mixed with a test smear, if S. enterica is present the antibody will attach and glow brighting in a fluorescent microscope. In this way it is very easy to test for the presence of a microbe of interest.
Staining for the electron microscope
Preparation of samples for the electron microscope is more complex than for the light microscope and a detailed description of it is beyond the scope of this book. There are also two different types of electron microscope, scanning and transmission, and the sample preparation for each of them is somewhat different. However, a few general points are worth mentioning. The resolution of the electron microscope is much higher than that of the light microscope, so the goal here is not to see microbes but rather to see specific structures and even molecules within microbes. However, this requires that these structures scatter electrons, something that they normally do not do to any great extent because they are largely composed of small atoms (C, H, N and O). To create more scattering, these stained with atoms of heavy metals such as osmium, lead or uranium. As with stains for light microscopy, the stains themselves fall into two general categories. Negative stains employ salts of these metals that fail to bind to most biological structures, so that the absence of staining indicates the presence of a structure. Positive strains employ salts that tend to bind to those same structures. This staining is performed on samples that have been desiccated and fixed in some way. Finally, because the electrons must pass through the sample, the support must be transparent to electrons. This is accomplished by using thin support films such as nitrocellulose, which is placed on a small copper grid to give it some stability - the regions of the sample in the holes of the copper grid are what is analyzed.
To view external structures, whole microbes are fixed, stained and then observed. It is also possible through various treatments to section cells, either by slicing on an ultramicrotome, an instrument that can create thin sections through a microbe of less than 100 nm, or by freeze fracturing microbes. Freeze fracture is a method in which frozen samples are sheared and then strained. It turns out that the plane of shearing often occurs along interesting structures, such as between bipolar membranes. The result is an image of the actual membrane surface showing specific proteins.
Microscopes
Magnification and resolution
A microscope enlarges the size of the intended image so that it is visible to the scientist. Most modern microscopes have two or more lenses and are therefore called compound microscopes. The lenses serve as prisms and bend light to a focal point and the distance from the lens to the focal point is called the focal length. Our eyes have a focal length of about 25 cm and cannot resolve objects by moving any closer. The focal length limits the smallest object we can see to about 0.2 mm in size. Convex lenses, those that are thick in the middle and narrower at the ends, shorten the focal length and when brought between an object and observer cause the object to appear much larger. If machined carefully a single lens can magnify an object up to several hundred times. However, if two lenses are placed one after another between object and observer, their magnification strength is multiplied. Thus if a 100X lens and a 10X lens are used, the total magnification would be 1000-fold.
Magnification is necessary to see very small objects, but the resolving power of the microscope (or the resolution of the object) is of equal importance. Resolution is defined as the ability to separate or distinguish objects that are close together and can be described by the equation in Figure 30.16

Figure 30.16. The resolution equation. A listing of the parameters that influence the resolution of a microscope. The resolution of a microscope is mostly limited by the wavelength used to visualize the sample. Light microscopes have as a maximum resolving power of 200 nm.
Where r is the resolution, λ is the wavelength of light, and NA is the numerical aperture of the lens.
For good microscopy it is desirable to have the resolution be as small as possible. This equation implies that it should be possible to improve resolution by either increasing the numerical aperture or by decreasing λ. In practice the numerical aperture of a lens is set by the construction of the lens and does not change. This leaves λ as a useful variable, and by decreasing the wavelength of light it is possible to increase the resolution. The resolution of the average 100 x objective lens (NA ~ 1.25) using short wavelength light (360 nm) is about 0.19 µmeters. If a longer wavelength of light is used (700 nm) the resolution increases to 0.39 µmeters.
Light microscopes
Many types of light microscopes have been developed over the years and they vary in price, sophistication and purpose. The simplest microscope is the light microscope that is basically a tube containing lenses and prisms that can magnify a sample to about 1000-fold. For magnification of greater than 100x, oil immersion lenses are used, which involves filling the small volume between the glass cover slip covering the sample and the microscope lens with oil. The refractive index of this oil is almost the same as that of glass, which thus avoids the problem of the light being bent through multiple environments and assists in the resolution as described by the equation in the previous section. Because of the general transparency of living samples, stained specimens are necessary and these procedures kill the bacteria. Objects in light microscopes appear dark in a bright background. Figure 30.17 shows an example of a typical light microscope.
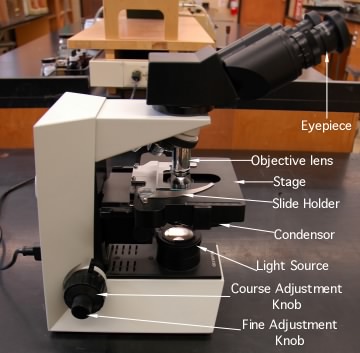
Figure 30.17. The light microscope. Pictured are the light microscopes used in the teaching labs of the Bacteriology Department at the University of Wisconsin-Madison. The various parts of the microscope are listed.
While light microscopes are valuable, it is sometimes desirable to view living microorganisms, for example to observe their chemotactic behavior. A phase contrast microscope is an excellent tool for these types of observations. A phase contrast scope depends upon the fact that light passing through a bacterium is slightly refracted and its phase is retarded 1/4 wavelength. The phase of light refers to positioning of the valleys and crests of the light waves in relation to one another. When light is in phase the light waves valleys and crests coincide, Figure 30.18, and when it is out of phase, they do not. If a sample contains bacteria, the light passing through the microbes will be shifted in comparison to light that did not hit any microbes. However our eyes are unable to detect slight phase differences.
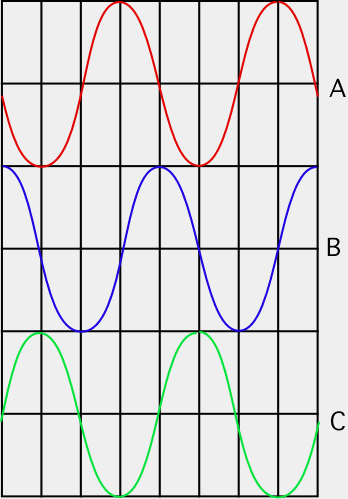
Figure 30.18. Waves and phases. Wave B is one-quarter wavelength out of phase with wave A. Wave C is one-half wavelength out of phase with wave A. If wave A and wave C collide, they will cancel each other out.
In phase microscopy, an optical trick is used to increase the contrast between the cells and their environment by artificially increasing the difference between light that has passed through the microorganism and light that has not. Three basic modifications are made to the phase scope to make this trick work: 1) uniformly in-phase light is used to illuminate the sample; 2) an annular diaphragm, located inside the condensor, permits only a ring of light to pass through the sample and into the objective; and 3) a phase-shifting plate, which is located inside each phase-contrast objective, contains a ring of material that advances the phase of the light 1/4 wavelength. The ring of light from the annular diaphragm is focused on the sample by the condensor. Light then passes through the sample, into the objective lens and up to the eye. To understand how the phase microscope works, imagine two sets of light rays that are passing through a slide on the microscope stage. The great majority of light rays pass through the sample, but are not altered by any microorganisms. The optics of the microscope are set up so that unaltered light rays coming from the sample pass through the phase-shifting material in the phase plate and are advanced 1/4 wavelength. A subset of light rays passing through bacteria have their phase retarded 1/4 wavelength, and are refracted. This slight refraction causes these light rays to miss the phase-shifting material in the phase plate, but they are still collected by the objective lens. As the two sets of light rays now journey towards the eye, they are focused and magnified by lenses in the eyepiece for viewing. The light rays that passed through the sample and contacted bacteria are now 1/2 wavelength out of phase with the light rays that did not. When light rays 1/2 out of phase mix together, they cancel each other out. Thus, a portion of the light coming from the background that did not pass through a microorganism will cancel out any light ray that did pass through a microbe and the object will appear dark to the viewer. Microorganisms typically appear dark in a light background and are called phase dark. Some objects that do not allow light to pass through them, such as bacterial endospores, appear very bright in the microscope and are termed phase-bright. Figure 30.36 shows an example of a phase contrast microscope image.
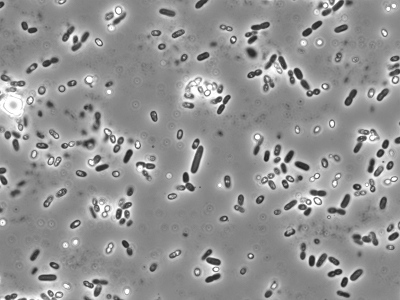
Figure 30.36. A phase contrast image. A phase contrast image of an Azotobacter sp. isolate at 100x magnification. This microbe was enriched from soil using Burk's medium.
Dark-field microscopes direct light at a sample from the side. Light hitting objects in the specimen is scattered in all directions and some of it is collected by the objective lens and directed to the eye. In dark-field microscopy, microbes appear light in a dark background. These microscopes have a higher resolving power than other light microscopes and are useful for examining objects with small diameters. Small or thin bacteria such as the spirochetes are only easily detected using dark-field microscopes and this can make them invaluable for studying such bacteria. Dark-field microscopes can also be used to visualize flagella or flagellar tufts in some species of microorganisms. Figure 30.19 shows an example of a specimen viewed through a dark-field microscope.
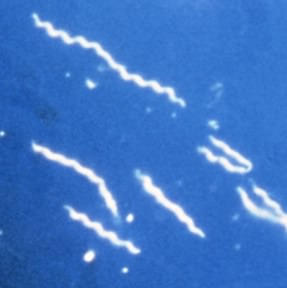
Figure 30.19. Dark-field micrsocopy. Visualization of Borrelia burgdorferi as seen through a dark-field microscope. B. burgdorferi is a very thin, spirillum and is difficult to visualize with a normal light microscope.
Another type of light microscope is the fluorescence microscope. This scope depends upon the ability of certain organic compounds to fluoresce. That is the ability of a molecule to absorb light at one wavelength and release it at another. Thus if a specific wavelength of light illuminates a sample, the fluorescent compound absorbs it and releases a second, distinctive wavelength that is easily visible using these microscopes. Fluorescent microscopes contain filters on their light sources that only allow a desired wavelength to illuminate the sample. As in the case of the dark-field microscope, light enters the sample in a direction perpendicular to the path it must travel to reach the objective and the observer. Therefore, the observer only sees the re-emitted fluorescent light. There are many fluorescent compounds that can be detected and microbes containing them fluoresce a distinctive color. For example, chlorophyll is naturally fluorescent and cyanobacteria fluoresce red when light of 546 nm illuminates them. Other microbes that contain no natural fluorescent compounds can be stained with fluorescent dyes, such as acridine orange. As we mentioned earlier, specific DNA probes attached to fluorescent dyes can also be used to identify specific groups of microorganisms.
Specialized microscopes
There are two major limitations to light microscopy. First, all forms of light microscopy end up displaying a two-dimensional image of a three-dimensional sample. Second, the use of light to illuminate the sample limits the maximum achievable resolution. Recall that the equation for resolution contains in its numerator the wavelength of electromagnetic radiation hitting the sample. The smallest wavelengths of visible light are in the blue spectrum and wavelengths below this are not visible to our eyes. Therefore while it is possible to make compound light microscopes that magnify samples many thousands of times, they are limited by the resolution that visible light can achieve to about 1,000-fold.
There are two main approaches to improving the visibility of samples beyond what a conventional light microscope can achieve. One method involves the use of special sensors or light sources. An example of this is the differential interference contrast microscope. This microscope employs a polarizer that creates planar polarized light. This is light that is all in one plane and entirely in phase. This light is split into two beams and both are directed at the sample, see Figure 30.20. Microbes in the sample have a slightly different refractive index than the surrounding environment and they cause a subtle change in the phase of the impacting rays. When the beams are recombined, the light waves that passed through objects in the sample will be slightly out of phase and an interference pattern will be established, which intensifies subtle differences in refractive index around cellular structures. The largest effect is around the edges of features that have distinct borders, thus differential interference contrast microscopy enhances the appearance of nuclei, spores, vacuoles and other inclusions.
Figure 30.20. Differential interference contrast microscopy. A movie of the developmental cycle of Caenorhabditis elegans, a nematode, is shown. C. elegans is heavily studied as a model system for development in eukaryotes. Beginning with a fertilized egg, scientists have tracked the developmental fate of all cells in the nematode all the way to the adult stage, containing over 900 cells.
A second example of using a specialized light source is scanning confocal microscopy. This is a type of fluorescence microscopy where a sample is illuminated with one wavelength that is absorbed by the sample. The excess light energy is later released as longer wavelength light and this is then collected and observed. Images generated by conventional fluorescence microscopy are degraded by the collection of light that is out of the focal plane. In scanning confocal microscopy this problem is solved by illuminating a single spot on the sample and scanning across the sample to collect a complete image. The spot of light is generated by passing light through an aperture or more commonly by using a laser of appropriate wavelength. This method avoids out-of-focus light collection because only a single focused spot is illuminated at any one time, and light intensity drops off rapidly above and below the focal plane. Confocal microscopes when operated in ideal situations can achieve resolutions that are 1.4 times higher than with a conventional light microscope. Figure 30.21 shows an example of a scanning confocal microscope.
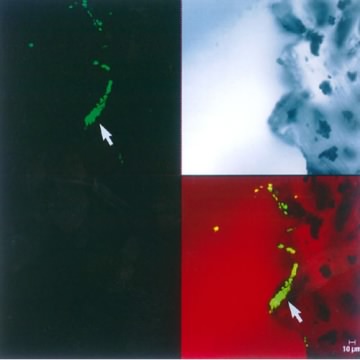
Figure 30.21. An image from a scanning confocal microscope. The upper left image shows a section from the tip of shunt tubing stained with SYTOX Green nucleic acid stain and examined by scanning confocal microscopy. The shunt was from an patient who had an infection with Coccidioides immitis that did not respond to treatment. The fungus had formed a biofilm on the shunt and prescribed antifungals could not penetrate the biofilm. The upper right image shows an unstained, transmitted light microscopic image of the same area of the edge of the tubing. The bottom right image shows a recombined image with the nucleic acid stain colocalized with the transmitted light image. The recombined image shows that a substantial (~30 µm) biofilm composed of 4- to 6-µm cells has colonized the scalloped surface of this tubing. (x630 total magnification mosaic). Image used from Larry E. Davis, Guy Cook, and J. William Costerton. Biofilm on Ventriculo-Peritoneal Shunt Tubing as a Cause of Treatment Failure in Coccidioidal Meningitis. Emerg Infect Dis [serial on the Internet]. 2002 April
Another example of a powerful method for visualizing cells is the atomic force microscope, which does not involve light at all and is not exactly a microscope in most senses of the term. It involves an almost unbelievable technology in which a tiny stylus is moved within a few atom lengths of the sample. This allows the detection of weak repulsive atomic forces between the stylus and molecules in the sample. As the stylus scans across the sample, changes in topology, due to objects such as individual atoms and molecules present in the specimen, cause the stylus to rise and fall. A computer collects this data and by combining the results of a complete scan an image can be created. Image resolution of the atomic force microscope can be incredibly small, magnifying samples up to 1,000,000 times, allowing the resolution of individual large metal atoms. It also has the advantage of simple sample preparation in comparison to the electron microscope. However, these microscopes are obviously expensive and take a long time to generate an image. Its extreme resolution also means that it is useful only for very small structures present on a very flat surface. This means that it is useful for examining individual protein molecules on an artificial surface, but not so successful in examining the uneven surfaces of real biological samples. Figure 30.22 shows an example of an AFM microscope.
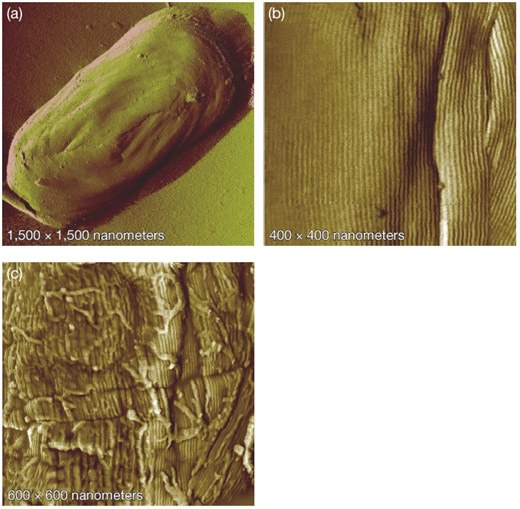
Figure 30.22. Endospores visualized with atomic force microscopy (AFM). AFM allows visualization of specimens at incredible resolutions. Picture here is an endospore from Bacillus atrophaeus at progressively higher magnifications. High magnification in (b) reveals an array of rod-like structures. Image courtesy of Lawrence Livermore National Laboratory
Electron microscopes
One method of increasing the resolution of a microscope is by using electromagnetic waves of a shorter wavelength than visible light. Waves outside of the visible spectrum are of course not visible to the naked eye and detectors have to be used to convert the output of these scopes into something that we can see. A convenient choice for this type of work is the electron. While most students think of electrons as particles, remember the dual particle-wave properties of elementary particles such as the electron and the photon. Electrons can be treated as waves, having characteristic wavelengths and can also be focused just like visible light, but with a magnetic lens instead of a glass one. The wavelength of electrons is much shorter that of light and thus can magnify things up to 100,000-fold. Indeed, the best pictures with these machines can resolve single atoms, albeit of heavy elements such as gold. This enables visualization of structures down to the size of individual protein molecules. However, electron beams are dispersed by particles in air and specimens therefore must be examined in a vacuum. As mentioned earlier, most biological samples do not scatter electrons well and have to be stained with heavy metals such as gold, osmic acid, permanganate, uranium or lanthanum salts. Treatment with these types of stains can distort microbial structures, as can the dehydration of samples in a vacuum.
There are two general methods of electron microscopy: transmission electron microscopy (TEM) and scanning electron microscopy (SEM). In TEM the set up of the microscope is analogous to that for a light microscope where the beam of electrons pass through the sample and is focused and collected on the other side for observation, Figure 30.23. Electrons cannot penetrate very far into tissues and samples must be very thin. A microbial sample is typically sliced into many sections and these are view in series to get a picture of the entire organism. If the outside structures of a microorganism, such as its flagella or pili, need to be observed, a negative staining technique allows observation by TEM. These pictures tend to be analogous to that obtained with a light microscope, except that the resolution is much higher.
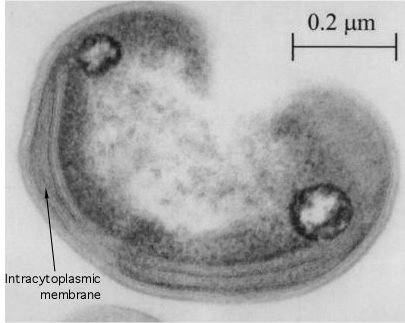
Figure 30.23. A transmission electron micrograph. A thin section of a Methylocystis sp, isolated from a rice patty.
There is another little complication here in that you are detecting structures by their ability to absorb electrons. But electrons moving at high speed have a lot of energy, so their absorption actually damages the delicate structures we want to resolve in the sample. The highest resolution pictures then can only be observed for a limited amount of time. This raises a common philosophical point that we often ignore. The methods we use to examine the behavior of microbes and the parts within them often perturb the very thing we wish to analyze. This is true of genetic approaches as well as biochemical ones. There is really no way around this problem except to be aware that we are doing it.
Alternatively, SEM, Figure 30.24, can be used to create a more 3-dimensional image of a sample. A sample is first coated with a thin film of heavy metal atoms so that it will absorb electrons that impact its surface. An electron beam then scans across a sample much as the electron gun in a cathode ray tube (found in older televisions and computer monitors) scans across the screen. The sample is set up so that the electrons striking the metal atoms on the target cause the emission of a shower of secondary electrons that is seen by a collector. The number of electrons that reach the collector is dependent upon the angle of the cell surface relative to the collector. By measuring the number of electrons that bounce off each spot of the specimen it is possible to create an image of the sample. As you might guess from this description, detecting scattering means that SEM has much poorer resolution than TEM. However, it provides stunning views of cells and their larger constituents that have a curious three-dimensional feel.
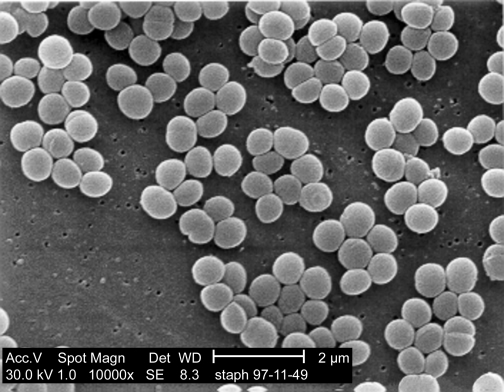
Figure 30.24. A scanning electron micrograph. An SEM of Staphylococcus aureus. Note the three dimensional appearance of the image.
X-ray crystallography
X-ray crystallography is also not microscopy, but it does provide images of molecules and involves variations on some of the same themes of microscopy, so we will handle it in this section. The actual methods of X-ray crystallography are not appropriate for this text, but a general description should be helpful. Scientists take highly purified proteins and create very concentrated solutions of these. They then let these sit under a variety of conditions and see if any small crystals form, rather like you might grow crystals of sugar on a piece of string suspended in a concentrated sugar solution. When crystals are found - and sometimes it is very difficult to obtain nice crystals of a reasonable size - they are removed and placed in a machine that shines X-rays on them. Consistent patterns in the crystal, formed because all of the proteins have lined up in the same way, diffract (essentially the same as reflect) the X-rays to specific positions. The scientists then examine all of the places to which the X-rays have been diffracted and, though some very complex mathematical analysis, are able to compute the two-dimensional electron density map at a given plane in the sample. These two-dimensional maps are then stacked together to reveal a three-dimensional density. However, this image of the overall electron density does not exactly reveal the actual bonds of the molecule in the sample. For that, the known sequence information (in the case of a protein) is carefully lined up ("threaded") with that electron density in such a way that it makes consistent sense. Then a structure can be modeled from this and statistically refined. The final product is a three-dimensional image of the positions of most or all of the atoms of the molecule, depending on the resolution of the analysis. Very high quality crystals can allow a resolution of less than 2 angstroms, which effectively means that one can visualize the positions of all atoms in the molecule larger than hydrogen. Some extremely high-resolution images can even resolve individual hydrogen atoms. Figure 30.25 shows examples of the models of a protein at different resolutions.
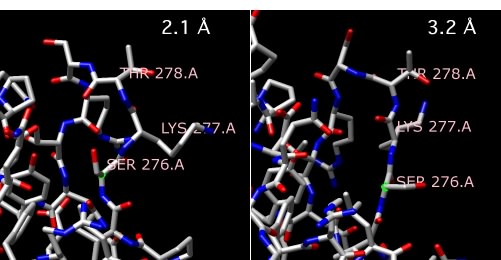
Figure 30.25. Comparing X-ray resolutions. Two structures of alpha amylase II from Thermoactinomyces vulgaris R-47. One structure is at 2.1 Å, while the other is at 3.2 Å Note that the structure of the three highlighted amino acids, serine 276, lysine 277 and threonine 278 changes as the resolution gets higher and more accurate.
So what does this really tell us? It reveals the exact structure of the form of the protein that crystallized in three dimensions. It also provides a good guess about one of the forms of the protein in solution, but there is always the chance that the crystallization itself perturbed the structure a bit. However, even if the determined structure does represent a structure that exists in solution, you should remember that proteins are almost always flexible molecules. Indeed, it is essential for enzymes to change shape a bit when they bind their substrates and again when the release that substrate. Some proteins actually undergo very large structural changes during the performance of their roles in the cell. As a consequence, a single structure of a protein represents no more than one possible form assumed by the protein in the cell. On the other hand, having any structure of a protein is essential if you are to understand physically how it performs its functions.
As the structures of more proteins are determined, we are getting a bit better at guessing the rules by which a protein's sequence determines its structure. At some point we will presumably not need to actually solve new protein structures, because our prediction methods will be so good, but that is a long time in the future. However, scientists have taken the first steps down this long road. Scientists have correctly predicted the 3-D structure of some small proteins (~20 residues) using only the primary sequence and a computer, but these were exceptional cases and accurate prediction of the structures of most proteins even of this size is currently beyond our abilities. However, there is another route to structure prediction whose application is already underway. Remember that evolution works by altering the function of existing proteins, and therefore one can make a reasonable prediction about a protein's structure if the structure of a homologous protein has been solved. Because completely novel protein structures are being solved at the rate a several per day, it is already the case that most newly sequenced genes can be roughly modeled for structure based on the known structure of a homologous protein.